| Ch 2. Particle Force and Acceleration | Multimedia Engineering Dynamics | ||||||
|
Rect. Coord. |
Normal/Tang. Coord. |
Polar Coord. |
Orbital Mechanics | Computational Mechanics | |||
| Computational Mechanics | Case Intro | Theory | Case Solution |
| Chapter |
| - Particle - |
| 1. General Motion |
| 2. Force & Accel. |
| 3. Energy |
| 4. Momentum |
| - Rigid Body - |
| 5. General Motion |
| 6. Force & Accel. |
| 7. Energy |
| 8. Momentum |
| 9. 3-D Motion |
| 10. Vibrations |
| Appendix |
| Basic Math |
| Units |
| Basic Dynamics Eqs |
| Sections |
| eBooks |
| Dynamics |
| Fluids |
| Math |
| Mechanics |
| Statics |
| Thermodynamics |
| ©Kurt Gramoll |
|
|
||
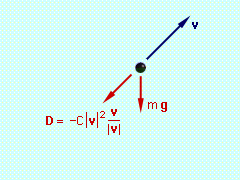
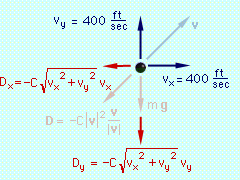
 Force Diagram - Vectors  Force Diagram - Components |
Begin with a free-body diagram. The velocity has been included on the free-body diagram for reference. To apply Eqs. 5, the x and y components of the total
force on the projectile must be determined. Since v/|v|
is a unit vector, D can be written as
The external forces are weight and drag, The x and y components of the total force are Now, consider the case when C = 0.002, and let Δt = 0.1. At the initial time to to = 0 vx(to) = 400 ft/s vy(to)
= 400 ft/s Using the four basic equations for position and velocity (Eqs. 5) the
following is determined, y - position |
|
|
|
||
|
x
- velocity x
- velocity |
||
|
|
Continuing this way, the results for the first five time-steps can be obtained as shown in the table at the left. These values can then be plotted to obtain an approximate solution for the trajectory of the projectile: When there is no drag (C = 0), the closed-form solution for the trajectory can be obtained and compared with the numerical solution. The graph below presents this comparison using Δt = 3.5s, Δt = 1.0s, and Δt = 0.1s. Notice that the numerical solution with Δt = 0.1s is the closest to the exact solution. This indicates that as the time-step is decreased, the numerical solution becomes more accurate.
|
|
 |
||
Practice Homework and Test problems now available in the 'Eng Dynamics' mobile app
Includes over 400 free problems with complete detailed solutions.
Available at the Google Play Store and Apple App Store.


