| Ch 3. Beam Shear/Moment Diagrams | Multimedia Engineering Mechanics | ||||||
|
Shear and Moment |
Shear/Moment Diagrams |
Moving Loads |
|||||
| Shear/Moment Diagrams | Case Intro | Theory | Case Solution | Example |
| Chapter |
| 1. Stress/Strain |
| 2. Torsion |
| 3. Beam Shr/Moment |
| 4. Beam Stresses |
| 5. Beam Deflections |
| 6. Beam-Advanced |
| 7. Stress Analysis |
| 8. Strain Analysis |
| 9. Columns |
| Appendix |
| Basic Math |
| Units |
| Basic Mechanics Eqs |
| Sections |
| Material Properties |
| Structural Shapes |
| Beam Equations |
| eBooks |
| Dynamics |
| Fluids |
| Math |
| Mechanics |
| Statics |
| Thermodynamics |
| ©Kurt Gramoll |
|
|
||
|
|
Introduction |
|
|
The trailer is 53 ft long and carries 79,500 lb. Since the load is assumed to be evenly distributed across the trailer bed, the load intensity, w, is w = (79,500 lb)/(53 ft) = 1,500 lb/ft = 1.5 kip/ft The trailer is support by two sets of wheels which can be modeled as simple pin joints as shown at the left. Joint A is at the left edge and joint B is at the center of the back wheels. Both of the support joints are approximate. |
||
| Free Body Diagram with Reactions |
||
|
|
The basic trailer can be modeled with a free body diagram to assist in finding the reaction forces. There will be a reaction at joint A and B. These can be found by using the static equilibrium equations, ΣMA = 0 The reaction at A can be found by summing forces, ΣFy = 0 |
|
 Beam Sections |
Sections |
|
| Now that the reaction forces are known, the beam can be cut into sections. This beam has one continuous load and two supports. Since one of the supports, the right one, is not at the beam edge, this will cause a discontinuity in the moment and shear diagrams. The beam will need to be analyzed at two places, once in each of the sections shown in the diagram. | ||
| Section 1) |
||
|
|
The first section is cut and the left part of the cut beam is used as shown in the diagram. The unknown internal shear V1 and moment M1 are applied at the cut edge to keep the beam section in equilibrium. These two loads can be determined from the equilibrium equations, giving ΣFy = 0 ΣMcut =
0 |
|
| Section 2) |
||
 Section 2 Cut |
The second cut is done between joint B and the right edge of the beam. This time, the right beam section will be analyzed. Again, the unknown internal shear V2 and moment M2 are applied at the cut edge. Note, that the direction of the internal loads are opposite from section 1 cut. This is because the opposite beam section (the right side) is used. This follows the sign convention specified in the previous section. Applying the equilibrium equations gives, ΣFy = 0 ΣMcut =
0 |
|
| Plot Shear and Moment Equations |
||
 Shear and Moment Diagrams |
Each of the two segments have different functions for the shear and moment. These can be plotted over each section to give a complete shear and moment diagram. These are shown at the left. With many shear and moment diagrams, a maximum is needed. In this problem, the first beam section increases and then decreases. To find the location of the maximum, equate the first derivative with respect to the locations, x, to zero. This gives, dM1/dx = 0
The maximum moment at 16.99 ft is 216.4 kip-ft which is a large moment. The moment is positive so the beam will be bent downward. This moment does exceed the maximum allowed of 200 kip-ft, so failure would be expected. |
|
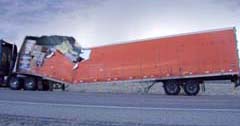 Truck Failed Near the Location of the Maximum Moment |
Discussion |
|
|
It is interesting to note that the maximum moment from the analysis agrees well with the location where the trailer failed. The failure can be due to other issues such as road quality and exact load distribution (it was assumed constant). Also the boundary conditions were assumed pinned which is a simplification to allow analysis. |
||
Practice Homework and Test problems now available in the 'Eng Mechanics' mobile app
Includes over 500 free problems with complete detailed solutions.
Available at the Google Play Store and Apple App Store.