| Ch 6. Integrals | Multimedia Engineering Math | ||||||
|
Indefinite Integral |
Area |
Definite Integral |
Fundamental Theorem |
Substitution Rule |
|||
| Area | Case Intro | Theory | Case Solution |
| Chapter |
| 1. Limits |
| 2. Derivatives I |
| 3. Derivatives II |
| 4. Mean Value |
| 5. Curve Sketching |
| 6. Integrals |
| 7. Inverse Functions |
| 8. Integration Tech. |
| 9. Integrate App. |
| 10. Parametric Eqs. |
| 11. Polar Coord. |
| 12. Series |
| Appendix |
| Basic Math |
| Units |
| eBooks |
| Dynamics |
| Fluids |
| Math |
| Mechanics |
| Statics |
| Thermodynamics |
| ©Kurt Gramoll |
| |
||||||||||||||||||||||||||
|
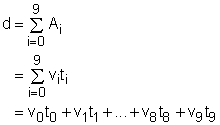
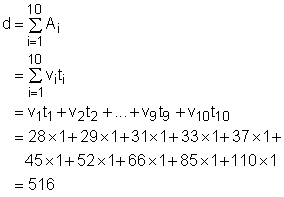
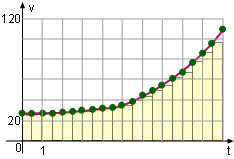
The velocity of a car for each second is shown in the table on the left. Estimate the total distance traveled by the car. Let the distance that the car travels to be d. Let the speed of the vehicle be v. The velocity of the car in each second is shown in the graph. Connect the points in the Velocity graph to form a smooth curve. Recall that the velocity multiplied by the time is the distance. In the diagram, the x-axis is time and y-axis is velocity. Therefore, the area under the curve between 0 and 10 is the distance the car has traveled. |
|||||||||||||||||||||||||
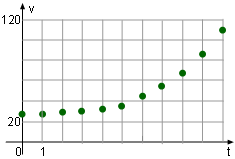 Velocity
 |
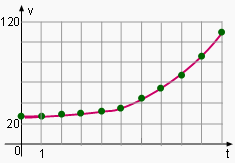
Velocity Curve |
|||||||||||||||||||||||||
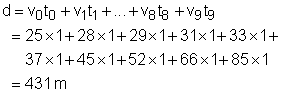
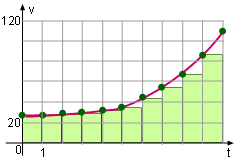 Estimated Distance Using Left Endpoints |
Assume that the velocity of the moving car remains unchanged during each second, so the area under the curve is the sum of the area in each second as shown on the left diagram. That is In this equation, the velocity for each second is listed in the table and the time interval is 1 second. Substituting the speed and the time interval into the above equation gives |
|||||||||||||||||||||||||
| Discussion |
||||||||||||||||||||||||||
|
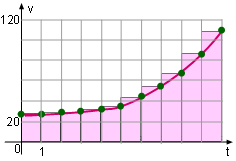
This problem can also be solved using the right endpoints as shown on the left graph. The estimated distance is As another formulation, this problem can be solved using the middle endpoints shown on the left diagram. The solution can be determined using the simulation in this section. |
|||||||||||||||||||||||||
 Reduce Time Interval |
The result of the estimated distance using the left and right endpoints are large. The way to reduce the difference between them is to minimize the time interval. For example, changing the time interval from 1 second to 0.5 second, as shown, can significantly reduce the error. | |||||||||||||||||||||||||