| Ch 3. Fluid Kinematics | Multimedia Engineering Fluids | ||||||
|
Flow Descriptions |
Steady & Unsteady |
Streamlines, Streaklines |
Velocity & Acceleration |
Irrotational Flow |
|||
| Flow Descriptions | Case Intro | Theory | Case Solution |
| Chapter |
| 1. Basics |
| 2. Fluid Statics |
| 3. Kinematics |
| 4. Laws (Integral) |
| 5. Laws (Diff.) |
| 6. Modeling/Similitude |
| 7. Inviscid |
| 8. Viscous |
| 9. External Flow |
| 10. Open-Channel |
| Appendix |
| Basic Math |
| Units |
| Basic Fluid Eqs |
| Water/Air Tables |
| Sections |
| eBooks |
| Dynamics |
| Fluids |
| Math |
| Mechanics |
| Statics |
| Thermodynamics |
| ©Kurt Gramoll |
|
|
||||||||||||||||||||||||||||||||||||||||||||||||||||||||||||||
| Introduction |
||||||||||||||||||||||||||||||||||||||||||||||||||||||||||||||
|
|
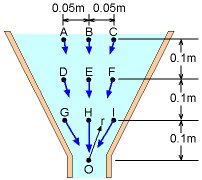
In a laboratory, two sets of experiments are conducted to measure the steady velocity in a funnel. The first set of the experimental data is collected at fixed locations, as shown in the figure. The measured velocities are:
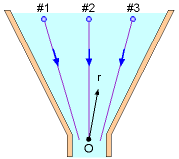
The second set of the experimental data is obtained by following three different fluid particles. As the fluid particle travels along its path, the velocity and its location (with respect to the origin, point O) are measured randomly:
Assume that the velocity is inversely proportional to the
square of the location r (see figures). Students are asked to find a
correlation to describe the
velocity field. |
|||||||||||||||||||||||||||||||||||||||||||||||||||||||||||||
| Questions |
||||||||||||||||||||||||||||||||||||||||||||||||||||||||||||||
Identify which viewpoint (Eulerian or Lagrangian) is used for the experiment. Also, find a correlation for the velocity. |
||||||||||||||||||||||||||||||||||||||||||||||||||||||||||||||
| Approach |
||||||||||||||||||||||||||||||||||||||||||||||||||||||||||||||
|
||||||||||||||||||||||||||||||||||||||||||||||||||||||||||||||

