| Ch 6. Entropy | Multimedia Engineering Thermodynamics | ||||||
| Entropy | Tds Relations |
Entropy Change |
Isentropic Process |
Isentropic Efficiency |
Entropy Balance (1) |
Entropy Balance (2) |
Reversible Work |
| Tds Relations | Case Intro | Theory | Case Solution |
| Chapter |
| 1. Basics |
| 2. Pure Substances |
| 3. First Law |
| 4. Energy Analysis |
| 5. Second Law |
| 6. Entropy |
| 7. Exergy Analysis |
| 8. Gas Power Cyc |
| 9. Brayton Cycle |
| 10. Rankine Cycle |
| Appendix |
| Basic Math |
| Units |
| Thermo Tables |
| eBooks |
| Dynamics |
| Fluids |
| Math |
| Mechanics |
| Statics |
| Thermodynamics |
| ©Kurt Gramoll |
| |
|||||
|
In the second law analysis, it is useful to plot the
process on diagrams for which has one coordinate is entropy. The two
diagrams commonly used
in second law analysis are temperature-entropy (T-s) and
enthalpy-entropy (h-s) diagrams. For some pure substance, like water,
the
entropy is tabulated with other properties. |
||||
| The T-s Diagram
|
|||||
|
|
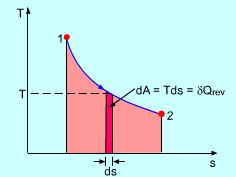
On a P-v diagram, the area under the process curve is equal, in magnitude, to the work done during a quasi-equilibrium expansion or compression process of a closed system. On a T-s diagram, the area under an internally reversible process curve is equal, in magnitude, to the heat transferred between the system and its surroundings. That is, Note the area has no meaning for irreversible processes. |
||||
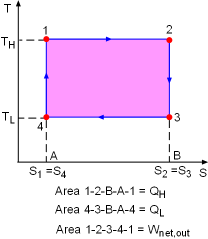 T-s Diagram of a Carnot Cycle |
The T-s diagram of a Carnot cycle is shown on the left. The area under process curve 1-2 (area 1-2-B-A-1) equals the heat input from a source (QH). The area under process curve 3-4 (area 4-3-B-A-4) equals the heat rejected to a sink (QL). The area enclosed by the 4 processes (area 1-2-3-4-1) equals the net heat gained during the cycle, which is also the net work output. |
||||
|
|
The h-s Diagram
|
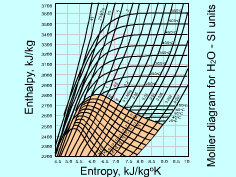
The enthalpy-entropy (h-s) diagram is valuable in the analysis of steady-flow devices such as nozzle, turbine, and compressor. The h-s diagram is also called Mollier diagram after the German
scientist R. Mollier. The Mollier diagram of water is shown on the
left. The Mollier diagram for water contains constant-quality lines,
constant-pressure lines, and constant-temperature lines. The temperature
lines in the mixture region are straight. |
|||
| The Tds Relations
| |||||
|
|
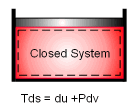
In the previous section, the definition of entropy is given by Rearranging the above equation gives The entropy change during an internally reversible process (1-2) is Only when the relation between δQ and T is known, the entropy change can be determined. The relations between δQ and T can be found by considering the energy balance of a closed system. The differential form of the energy balance for a closed system, which contains a simple substance and undergoes an internally reversible process, is given by dU = δQrev - δWrev (2) The boundary work of a closed system is δWrev = PdV (3) Substituting equations (1) and (3) into equation (2) gives dU = TdS- PdV or Tds = du +Pdv (4) where Equation (4) is known as the first relation of Tds, or Gibbs
equation. |
||||
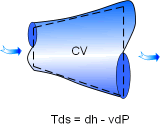 The Tds Relations for Open System |
The definition of enthalpy gives h = u + Pv differential the above equation yields dh = du +Pdv + vdP Replacing du + Pdv with Tds yields dh = Tds + vdP Equation (5) is known as the second relation of Tds. Although the Tds equations are obtained through an internally reversible process, the results can be used for both reversible or irreversible processes since entropy is a property. Rewriting equations (4) and (5) in the following form ds = du/T + Pdv/T The entropy change during a process can be determined by integrating the above equations between the initial and the final states. |
||||
