| Ch 2. Pure Substances | Multimedia Engineering Thermodynamics | ||||||
| Phase |
Property Diagrams |
Property Tables |
Ideal Gas |
||||
| Ideal Gas | Case Intro | Theory | Case Solution |
| Chapter |
| 1. Basics |
| 2. Pure Substances |
| 3. First Law |
| 4. Energy Analysis |
| 5. Second Law |
| 6. Entropy |
| 7. Exergy Analysis |
| 8. Gas Power Cyc |
| 9. Brayton Cycle |
| 10. Rankine Cycle |
| Appendix |
| Basic Math |
| Units |
| Thermo Tables |
| eBooks |
| Dynamics |
| Fluids |
| Math |
| Mechanics |
| Statics |
| Thermodynamics |
| ©Kurt Gramoll |
| |
||||||||||||||||||||||||||||||||||||||||||||||||||||||||
| The Ideal-gas Equation of State |
||||||||||||||||||||||||||||||||||||||||||||||||||||||||
Any equation that relates the pressure, temperature, and specific volume of a substance is called the equation of state. The following equation is the ideal-gas equation of state. A gas that obeys this relation is called an ideal gas. Pv = RT R is the gas constant, which is determined from R = Ru/M where The ideal-gas equation of state can also be expressed as PV = mRT or PV = nRuT where For a fixed mass system (m = constant), the properties of an ideal gas at two different states can be related as P1v1/T1 =
P2v2/T2 |
||||||||||||||||||||||||||||||||||||||||||||||||||||||||
| Equations of State for a Non-ideal Gas |
||||||||||||||||||||||||||||||||||||||||||||||||||||||||
The ideal-gas equation of state is very simple, but its application range is limited. The following three equations which are based on assumptions and experiments can give more accurate result over a larger range. Van der Waals Equation of State: The Van der Waals equation of state was proposed in 1873, and it states that (P + a/v2)(v-b) = RT a = 27 R2(Tcr)2/(64Pcr) where Van der Waals equation of state is the first attempt to model the behavior of a real gas. However, it is only accurate over a limited range. Beattie-Bridgeman Equation of State: The Beattie-Bridgeman equation of state was proposed in 1928. It has five experimentally determined constants. |
||||||||||||||||||||||||||||||||||||||||||||||||||||||||
|
The properties with a bar on top are molar basis. The five constants can be found in the table below where P is in kPa, |
|||||||||||||||||||||||||||||||||||||||||||||||||||||||
Classical Thermodynamics, 3rd ed., p46, table 3.3 |
||||||||||||||||||||||||||||||||||||||||||||||||||||||||
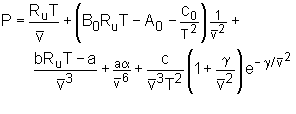
Benedict-Webb-Rubin Equation of State: Benedict, Webb, and Rubin raised the number of experimentally determined constants in the Beattie-Bridgeman Equation of State to eight in 1940.
|
||||||||||||||||||||||||||||||||||||||||||||||||||||||||
|
||||||||||||||||||||||||||||||||||||||||||||||||||||||||
| Compressibility Factor |
||||||||||||||||||||||||||||||||||||||||||||||||||||||||
 Generalized Compressibility Chart |
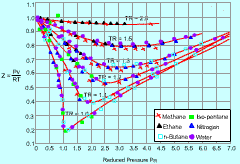
The compressibility factor (Z) is a dimensionless ratio of the product of pressure and specific volume to the product of gas constant and temperature. Z = (Pv) / (RT) The compressibility factor (Z) is a measure of deviation from the ideal-gas behavior. For ideal gas, Z is equal to 1. Z can be either greater or less than 1 for real gases. The further away Z is from unity, the more the gas deviates from the ideal-gas behavior. |
|||||||||||||||||||||||||||||||||||||||||||||||||||||||
 Generalized Compressibility Chart |
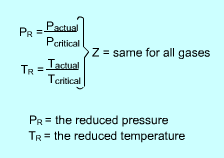
The generalized compressibility chart is developed to be used for all gases. They are plotted as a function of the reduced pressure and reduced temperature, which are defined as follows: PR = P/Pcr and TR= T/Tcr where |
|||||||||||||||||||||||||||||||||||||||||||||||||||||||
 Percentage of error involved in assuming steam to be an ideal gas |
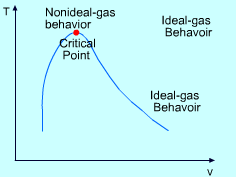
From the generalized compressibility chart, the following observations can be made.
The animation on the left shows the error involved in assuming steam to be an ideal gas. The red region where steam can be treated as an ideal gas has error of less than 1%. percentage of error = (|vtable - videal|/vtable) (100%) |
|||||||||||||||||||||||||||||||||||||||||||||||||||||||

