| Ch 2. Pure Substances | Multimedia Engineering Thermodynamics | ||||||
| Phase |
Property Diagrams |
Property Tables |
Ideal Gas |
||||
| Property Diagrams | Case Intro | Theory | Case Solution |
| Chapter |
| 1. Basics |
| 2. Pure Substances |
| 3. First Law |
| 4. Energy Analysis |
| 5. Second Law |
| 6. Entropy |
| 7. Exergy Analysis |
| 8. Gas Power Cyc |
| 9. Brayton Cycle |
| 10. Rankine Cycle |
| Appendix |
| Basic Math |
| Units |
| Thermo Tables |
| eBooks |
| Dynamics |
| Fluids |
| Math |
| Mechanics |
| Statics |
| Thermodynamics |
| ©Kurt Gramoll |
| |
||
| T-v Diagram |
||
|
|
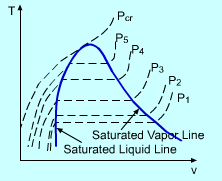
The phase-change process of water under 1 atm described in the previous section can be repeated for different pressures. Put all the processes in the T-v diagram. A line connected by all the saturated liquid states is called saturated liquid line. All the saturated vapor states are connected to create the saturated vapor line. When pressure becomes as high as Pcr (critical pressure), the saturated liquid state and the saturated vapor state become a single point in T-v diagram. This point is called the critical point. For water, Pcr equals 22.09 MPa, Tcr (critical temperature) equals 374.14 oC. At pressure above the critical pressure, there will not be a distinct phase. The saturated liquid line and saturated vapor line divide the region on the T-v diagram into three regions: subcooled liquid region, saturated liquid-vapor region and superheated vapor region. |
|
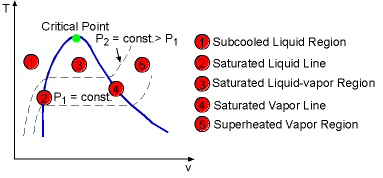 The Construction of T-v Diagram |
||
| P-v Diagram |
||
 Piston-cylinder Device for P-v Diagram
|
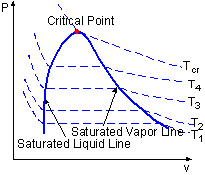
The water vaporization process can also be described in P-v diagram. The method of creation the P-v Diagram is much like the method for the T-v diagram. By considering the piston-cylinder device again, the temperature keeps constant by heat transfer. The pressure is changed by removing the weight. Like the process in previous section, the water will become saturated liquid, saturated mixture, saturated vapor and superheated vapor if enough heat added. The process is repeated under several different temperatures and plot them in a P-v diagram. By connecting all the saturated liquid states under different temperatures, one can create the saturated liquid line and connecting all the saturated vapor states, one can create the saturated vapor line on the P-v diagram. There are three regions on the P-v diagram: subcooled liquid region, saturated liquid-vapor region, and superheated vapor region.
|
|
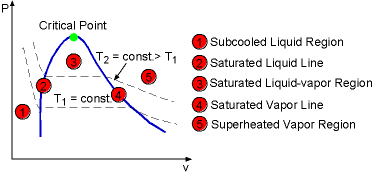 The Construction of P-v Diagram |
||
|
|
P-v Diagram Including Solid Phase |
|
The above diagram can be extended to include solid phase as well as the solid-liquid and solid-vapor regions. Under some conditions, all three phase can coexist in equilibrium. On a P-v diagram, it forms the triple line and on a T-v diagram, it forms only a point called the triple point. |
||
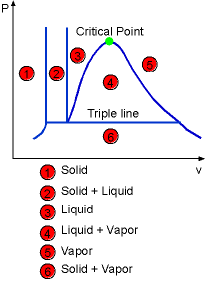
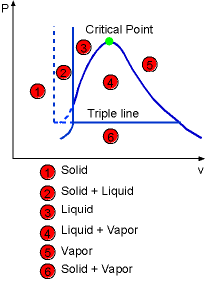 The Construction of P-v Diagram of a Substance that Contracts (left) or Expends (right) on Freezing |
||
| P-T Diagram |
||
| The P-T diagram is called the phase diagram
because three phases are separated from each other by three lines (sublimation,
melting, and vaporization). The three lines meet at the triple point where
three phases
coexist in equilibrium. |
||
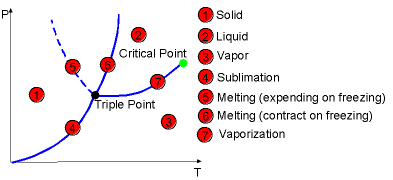 The Construction of P-T Diagram |
||

