| Ch 12. Infinite Sequences and Series | Multimedia Engineering Math | ||||||
|
Sequences and Series |
Integral and Comparison |
Alt. Series & Abs. Conv. |
Power Series |
Taylor, Mac. & Binomial |
|||
| Alternating Series and Absolute Convergence | Case Intro | Theory | Case Solution |
| Chapter |
| 1. Limits |
| 2. Derivatives I |
| 3. Derivatives II |
| 4. Mean Value |
| 5. Curve Sketching |
| 6. Integrals |
| 7. Inverse Functions |
| 8. Integration Tech. |
| 9. Integrate App. |
| 10. Parametric Eqs. |
| 11. Polar Coord. |
| 12. Series |
| Appendix |
| Basic Math |
| Units |
| eBooks |
| Dynamics |
| Fluids |
| Math |
| Mechanics |
| Statics |
| Thermodynamics |
| ©Kurt Gramoll |
|
|
||||||||||||||||||||||||||||
|
Series (n =12)
|
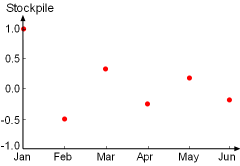
Based on the stockpile data on the left, it is noted that the sum of the stockpiles follows the following trend and can be represented by the series:
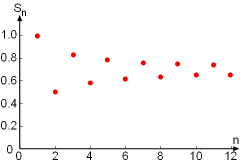
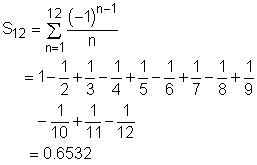
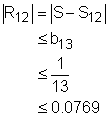
where n represents the month (i.e., n = 1 is January, n = 2 is February and so on). It is also recognized that this series is alternating harmonic series. To determine if the warehouse is suitable or not in long run, the partial sum of the series for n = 12 is obtained as an approximation: Since the warehouse is 65.3% occupied by the end of a year, which is a little more than half, the warehouse is considered suitable for a long period of time. The error involved in using the partial sum as an approximation for the total sum is given by: |
|||||||||||||||||||||||||||


