| Ch 5. Curve Sketching | Multimedia Engineering Math | ||||||
|
Curve Sketching |
Graphing | ||||||
| Graphing | Case Intro | Theory | Case Solution |
| Chapter |
| 1. Limits |
| 2. Derivatives I |
| 3. Derivatives II |
| 4. Mean Value |
| 5. Curve Sketching |
| 6. Integrals |
| 7. Inverse Functions |
| 8. Integration Tech. |
| 9. Integrate App. |
| 10. Parametric Eqs. |
| 11. Polar Coord. |
| 12. Series |
| Appendix |
| Basic Math |
| Units |
| eBooks |
| Dynamics |
| Fluids |
| Math |
| Mechanics |
| Statics |
| Thermodynamics |
| ©Kurt Gramoll |
| |
||
In the previous section, the method of sketching a curve was introduced. In this section, the curve will be drawing by computer and refined with concepts discussed in last section. |
||
|
Refining Computer Plotted Graphic |
||
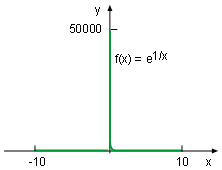 Function f(x) = e1/x
|
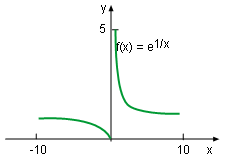
Curve sketching is difficult even with the help of a computer. For example, over what interval should a function be plotted so that all the key features are shown on the curve? Plotting programs may give a poor interval and result in some important characteristics "missing". In such cases, the graph of the function needs to be refined. To better understand this concept, plot the curve of function f(x) = e1/x. The first graphic at the left is plotted by MathCad using its default settings. Of course, if other programs are used, such as Maple and Matlab, the diagram might be slightly different layout. Since this function spikes at x = 0, the graphic shows little detail information about the function. A second diagram shows the function replotted by setting the range of y value between 0 and 5. It is clear that the domain of the function is (-∞, 0) and (0, +∞), so it has no intercept with the x axis.
|
|
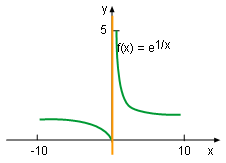 Function f(x) = e1/x with vertical asymptote |
When x approaches 0+, 1/x is closer to +∞, and thus the limit of e1/x is +∞. This can be expressed with the expression, According to the definition, function f(x) = e1/x has a vertical asymptote at x = 0 as shown on the left diagram. When x approaches 0-, 1/x is closer to -∞, and thus the limit of e1/x is 0. This can be expressed with Therefore, the function does not have vertical asymptote when x is less than 0. |
|
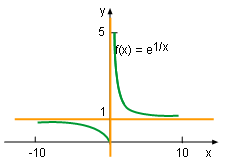 Function f(x) = e1/x with horizontal and vertical asymptotes |
Notice that when x approaches +∞, 1/x is extremely close to 0 and causes the value of the function to be nearly 1. This can be expressed with mathematic equation Similarly, Therefore, function f(x) = e1/x has a horizontal asymptote at y = 1 by definition as shown on the left graphic. |
|
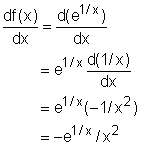
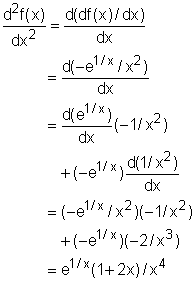
In order to analysis the monotonicity, local extreme value, concavity and inflection point, the first and second derivative needs to be calculated. They are Since e1/x and x2 are larger than 0 in the domain of the function, the first derivative value of the function is negative according to equation (1), and thus the function is decreasing for all x by the Test for Monotonic Functions. This characteristic has been shown in the previous diagrams. |
||
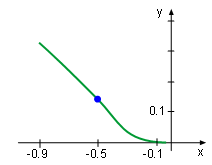 Function f(x) = e1/x in which x is between -0.9 and 0 |
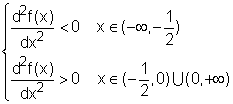
According to equation (2), the sign of the second derivative can be determine with the following expression. So the function is concave upward in the interval between( -1/2, 0) and between (0, +∞), and concave downward between ( -∞, -1/2). In order to plot concavity on the diagram, the curve of the function is zoomed in as shown on the left. By definition, the inflection point for this function is at x = -1/2 because equation (2) changes sign at this point. It is also marked on the left diagram. Notice that it is difficult to see all the key features in one diagram and this is one of the reason to refine computer plotted graphic. |
|
 (1)
(1) (2)
(2) (3)
(3)